![]()
Fuel adulteration affects a wide range of stakeholders ranging from consumers and fuel/energy companies to the state, the environment and public health. The "APOFASH" project combines the expertise of LPC S.A. (a member of the Motor Oil Group) in fuels and lubricants with the knowledge on lasers and spectroscopy of IESL-FORTH and optical instruments development experience of the Technical University of Crete in order to develop an innovative mobile optical spectroscopy system able to detect fuel adulteration at any point of interest with high sensitivity and low cost. This new approach will use the spectral footprint of a fuel or an adulterant in order to identify it in a sample. The prototype instrument will be compact, portable and designed for use by non-experts.
![]()
The implementation of the project is divided into 4 Work Packages (WPs). The preparation of fuel-adulterants sample mixtures at various concentrations and sample characterization by properties such as density, boiling point and refractive index and by gas chromatography is the subject of the WP1. We focus on three fuel adulteration categories: (1) adulteration of “expensive” fuel with a “cheap” fuel (e.g. 100 octane gasoline with 95 octane gasoline), (2) adulteration of fuel with oil waste (e.g. adulteration of diesel with lubricant oils waste) and (3) adulteration of fuel with chemical solvents (e.g. adulteration of gasoline with toluene). Within those three categories, we focus on fourteen types of adulteration (adulterant in fuel):
- Unleaded gasoline in “super unleaded” gasoline
- Heating diesel in car diesel
- Marine diesel in car diesel
- Lubricant oil waste (LOW) in car diesel
- Distillate LOW in car diesel
- SN150 lubricant in car diesel
- Ethanol in gasoline
- DMF in gasoline
- Toluene in gasoline
- White spirit in gasoline
- Ethanol in car diesel
- DMF in car diesel
- Toluene in car diesel
- White spirit in car diesel
In WP2 the samples of WP1 are measured using 5 spectroscopic techniques: UV absorption, vis-NIR absorption, FT-IR with ATR, fluorescence and Raman. Where required, samples are also measured using laser spectroscopy (e.g. LIF, CARS). The spectra are analyzed using multivariate analysis methods, such as Partial Least Squares (PLS) regression to determine which techniques are most suitable for use in the portable adulteration detection system and to develop analytical adulteration detection protocols.
In WP3 the portable fuel adulteration detector prototype is developed, using the knowledge obtained in WP2 and the samples generated in WP1 for calibrating the instrument. Additional samples will be used in calibration where necessary. The detection protocols, developed in WP2 will be modified accordingly for use in the portable prototype.
Finally, in WP4, the portable system will be used to measure samples from the fuel chain, with the capability for additional sample preparation (WP1), laboratory spectroscopic measurements (WP2) and upgrades of the original device (WP3) if and where needed.
DELIVERABLES
In addition to the portable fuel adulteration detector spectrometer instrument (Deliverable 3.4) the (15 in total) deliverables of the project include reports for each WP (Deliverables 1.1, 2.1, 3.1, 4.1), publications in scientific journals (Deliverables 1.2 , 2.2, 3.2, 4.2) and national / international conferences (Deliverables 1.3, 2.3, 3.3, 4.3), the present website and in general the online presence of the project (Deliverable 1.4) and the organization of a project-related scientific meeting (Deliverable 4.4).
Principal Investigator

Scientific Staff

Students

Alumni


![]()
In addition to the portable fuel adulteration detector spectrometer instrument (Deliverable 3.4) the (15 in total) deliverables of the project include:
Reports for each WP (Deliverables 1.1, 2.1, 3.1, 4.1): delivered to ΕΥΔΕ-ΕΤΑΚ with the final report of the project
Publications in scientific journals (Deliverables 1.2 , 2.2, 3.2, 4.2): a total of six papers will be published as results from the APOFASH project.
National / international conferences (Deliverables 1.3, 2.3, 3.3, 4.3): Project results have been presented at five national & international scientific conferences.
The present website (Deliverable 1.4)
The organization of a project-related scientific meeting, whch -due to COVID19- has been replaced by videos of results (Deliverable 4.4):
ΑΠΟΦΑΣΗ - Αποτελέσματα ΕΕ2 - Νοθεία ακριβού με φθηνό καύσιμο
ΑΠΟΦΑΣΗ - Αποτελέσματα ΕΕ2 - Νοθεία καυσίμου με απόβλητα έλαια
ΑΠΟΦΑΣΗ - Αποτελέσματα ΕΕ2 - Νοθεία καυσίμου με διαλύτες
![]()
NOTE: The Results page of APOFASH is currently under construction to include the latest results of the project. Please visit this page often for updates!
WP1
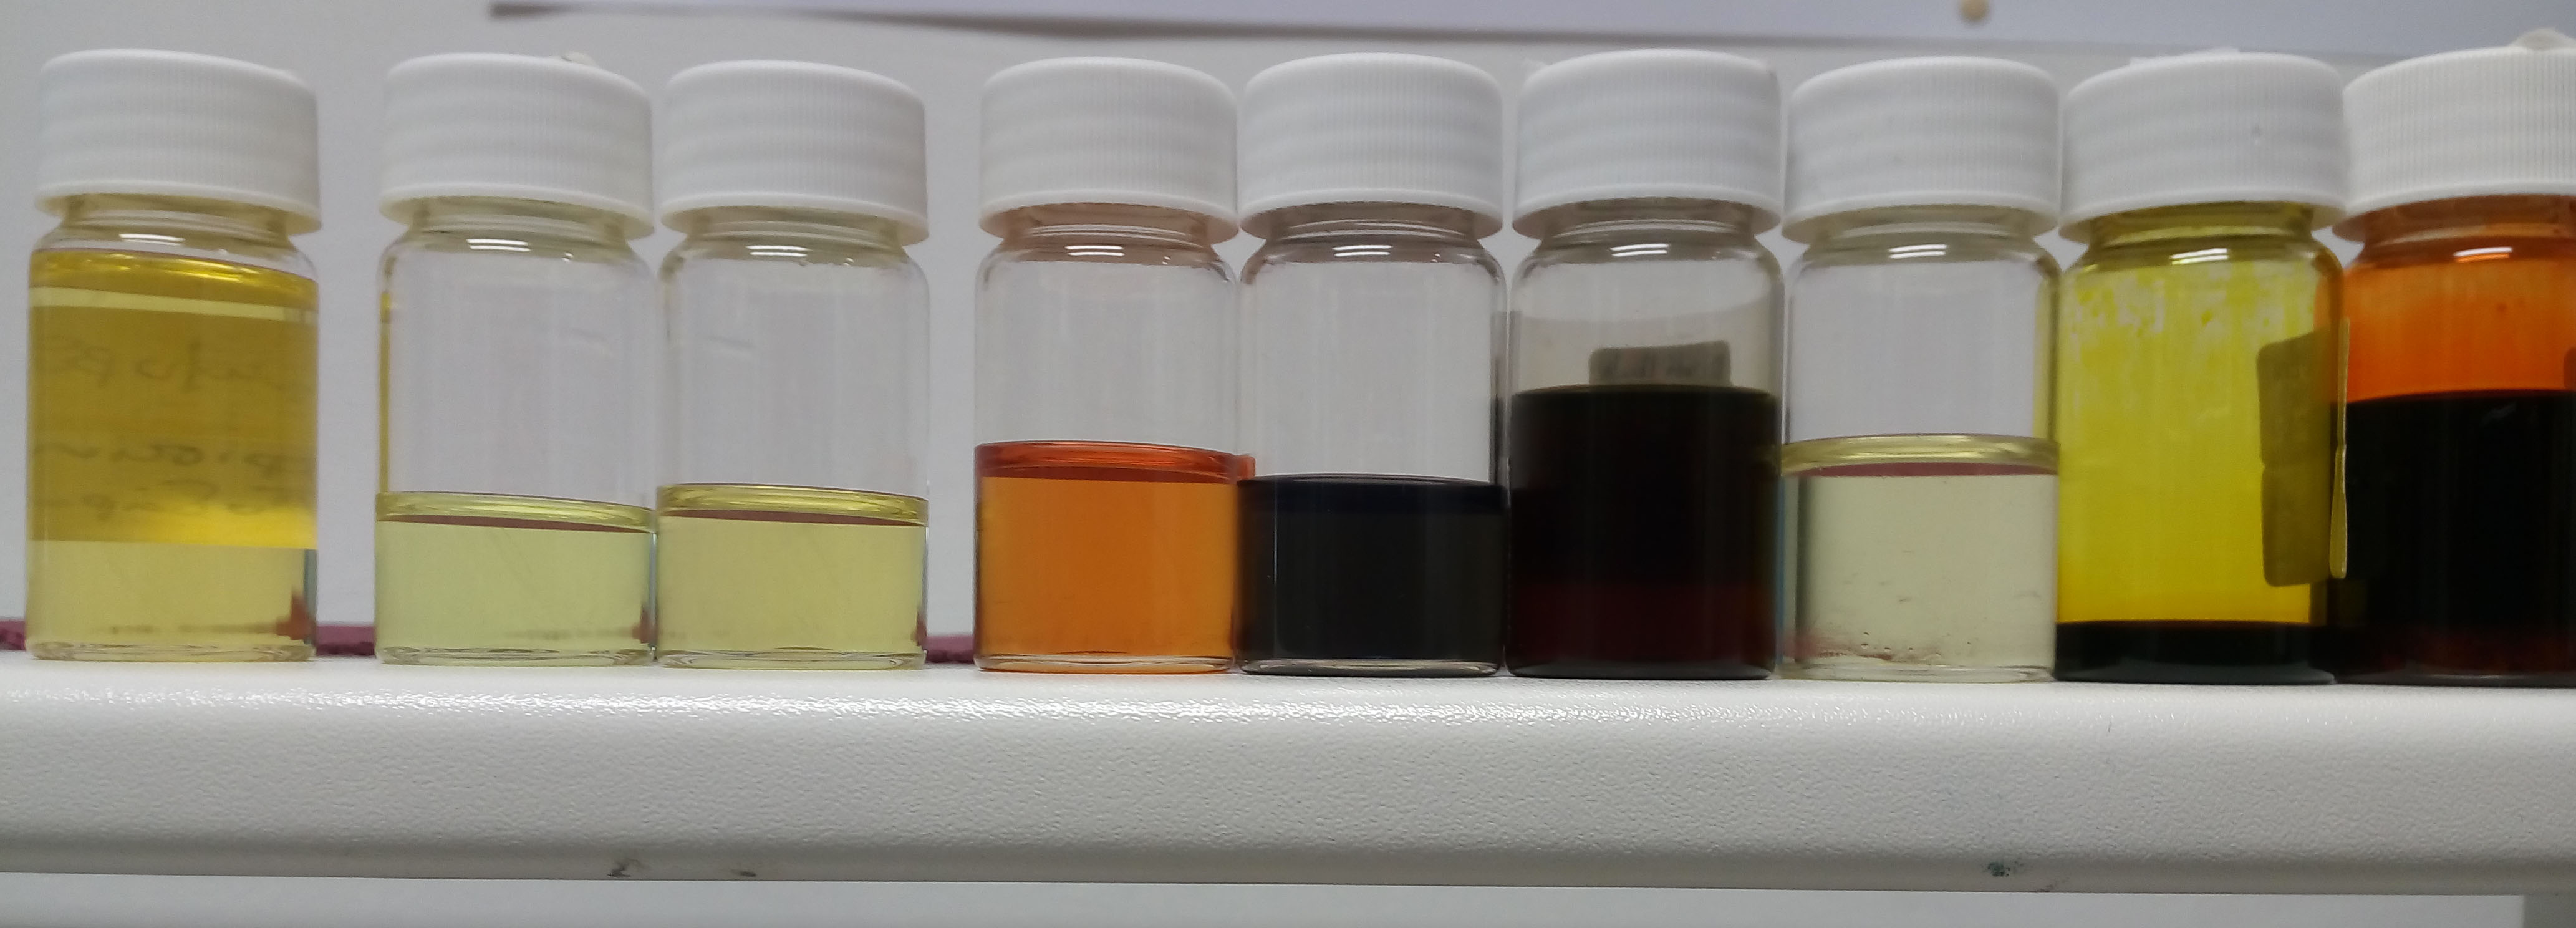
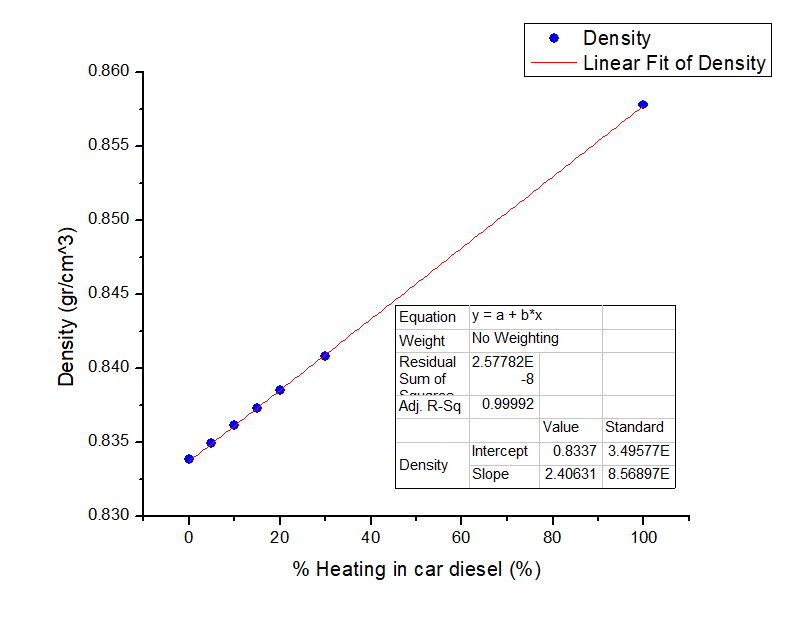
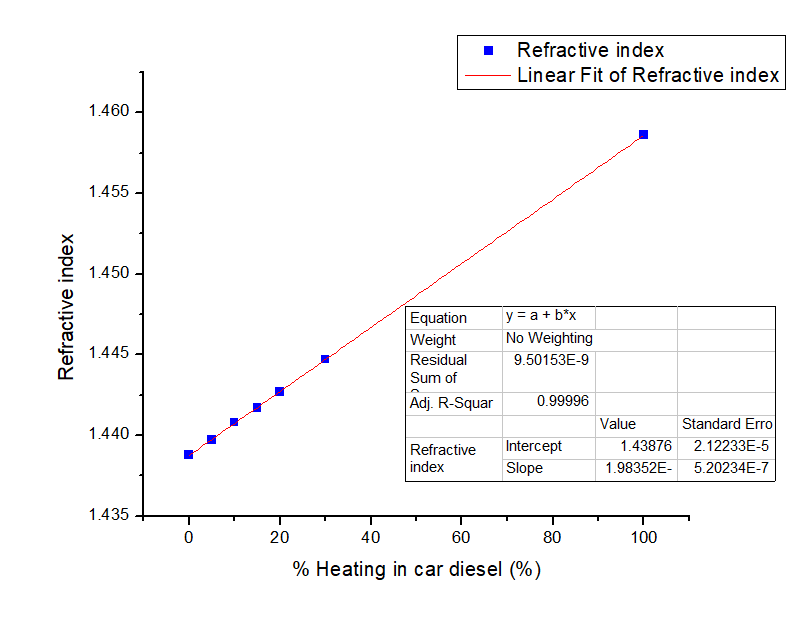
Series of adulterant-fuel mixture samples at 5-7 different concentrations for each of the fourteen adulteration types tested, were prepared. Samples were characterized based on their physicochemical properties (density, refractive index, boiling point). We verified that some physicochemical properties (e.g. density) can be used to detect adulteration with very good results. In the image below we show indicative plots of sample density and refractive index for various heating diesel (adulterant)/car diesel (fuel) mixtures. The correlation coefficient R2 is 0.9999 in both cases.
We also characterized the samples using gas chromatography combined with mass spectrometry (GCMS) at IESL-FORTH labs. Results from GCMS peak analysis and PLS analysis will be added here when completed.
WP2
Spectra for all the samples at all concentrations were measured at IESL-FORTH labs with five spectroscopic techniques:
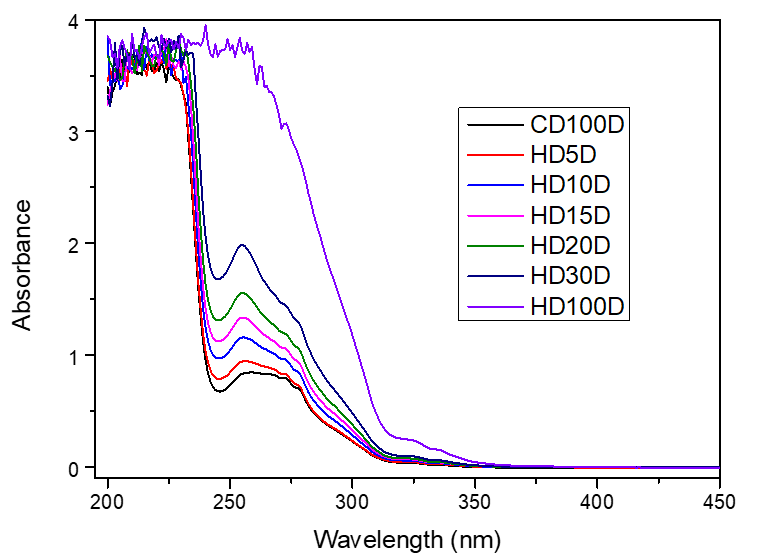
- UV absoprtion in the range 200 nm - 450 nm
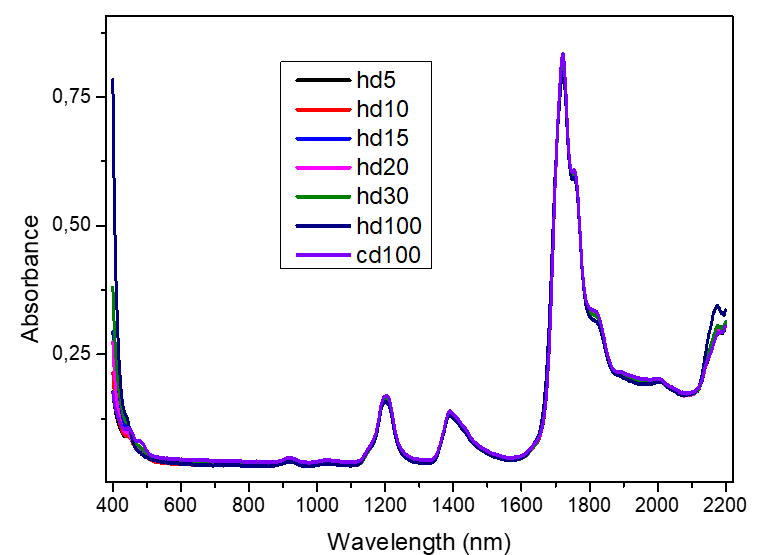
- vis-NIR absorption in the range 400 nm - 2200 nm or 400 nm - 2200 nm
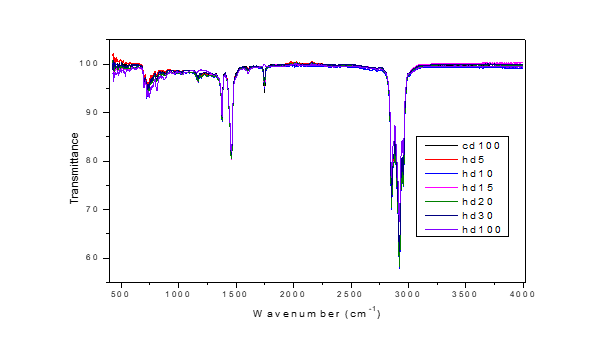
- FT-IR using Attenuated Total Reflection [ATR] in the range 500 cm-1 - 4000 cm-1
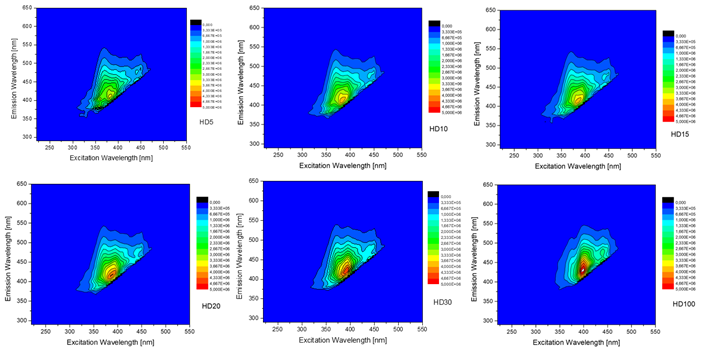
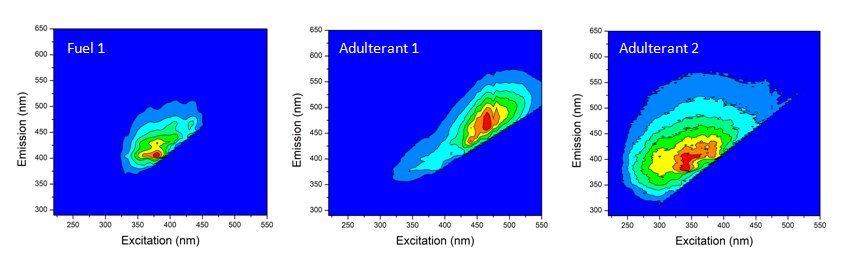
- Fluorescence with excitation in 200nm - 550 nm and emission in 300 nm - 650 nm
- Raman, with 1064 nm excitation, measuring shift in 50 cm-1 - 2500 cm-1
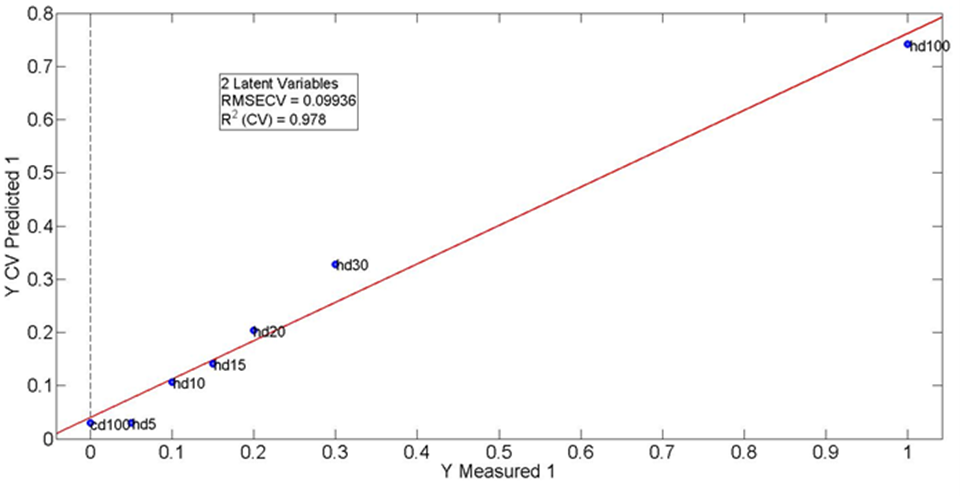
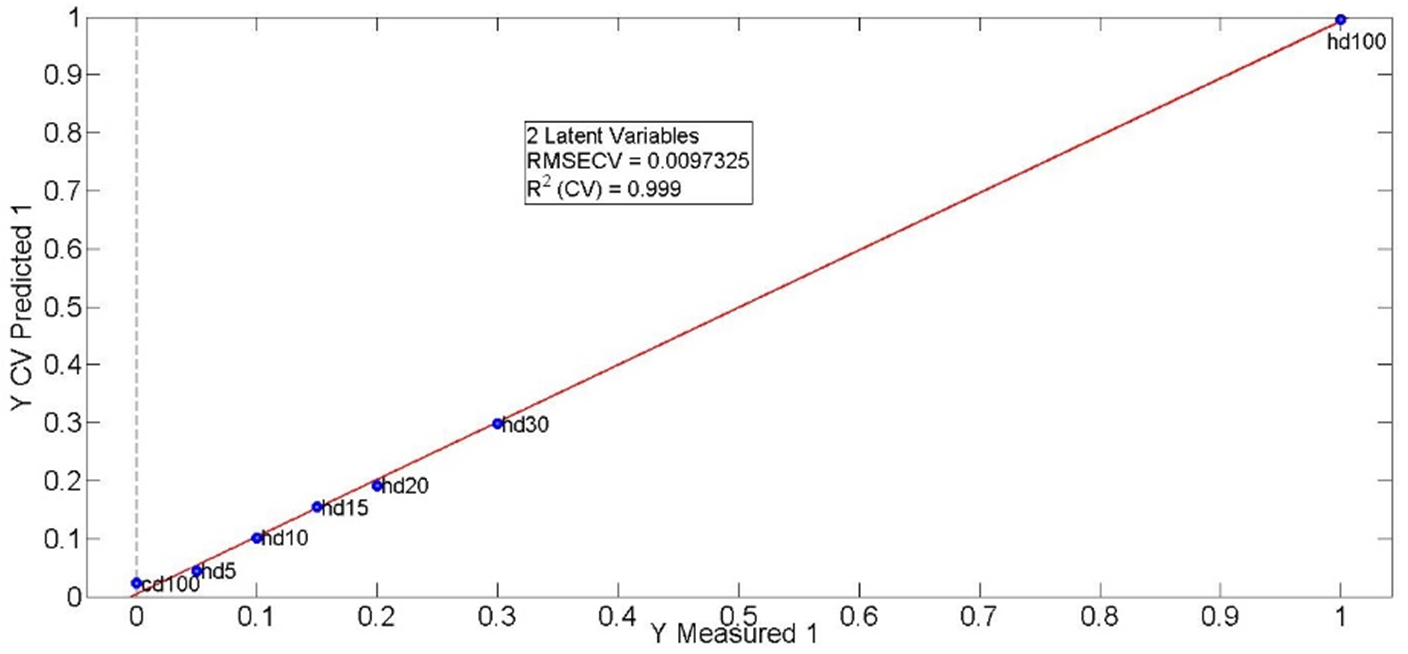
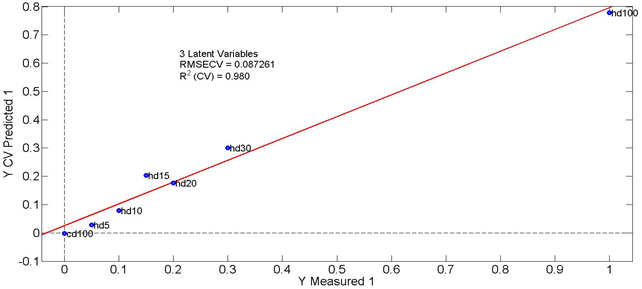
Sample spectra of car diesel adulterated with heating diesel at different concentrations (0, 5, 10, 15, 20, 30 and 100% heating in car diesel) are shown below. The spectra were analyzed with Partial Least Squares (PLS) regression to evaluate the correlation between the adulterant concentration and the spectral data. The PLS correlation plot (actual [X] vs. model-predicted [Y] adulteration fraction is also shown below for each spectroscopic technique after the spectrum.
- UV absorption
- Vis-NIR absorption
- FTIR (with ATR)
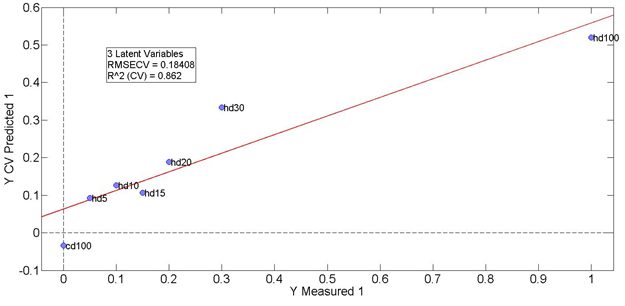
- Fluorescence

- Raman
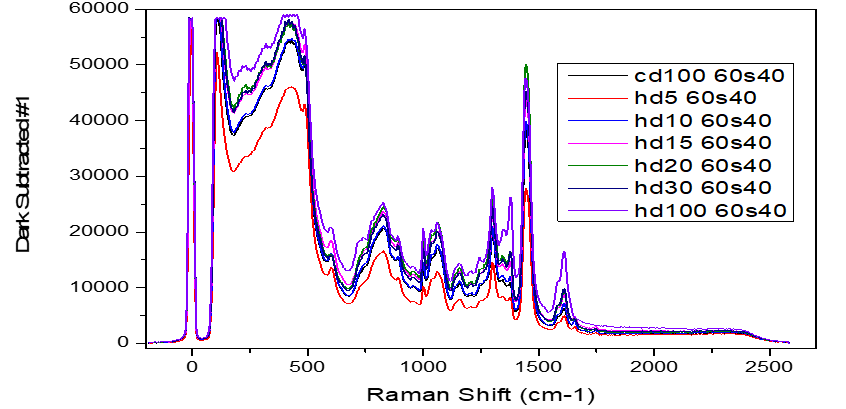
Legend: CD100=100% car diesel (0% heating diesel), HDi= i% of heating in car diesel, HD100%=100% heating diesel.
PLS analysis is competed for all samples. The table below shows correlation coefficients (R2) and errors (RMSECV:Root Mean Square Error for Cross Validation) for selected adulteration series. Low errors and high R2 indicate techniques suitable to quantify the given type of adulteration.
|
|
UV |
NIR |
FTIR |
Φθορισμός |
Raman |
|
1. Adulteration of SUPER UNLEADED GASOLINE with UNLEADED GASOLINE |
|||||
|
R2 |
0.963 |
0.992 |
|
0.983 |
0.81 |
|
RMSECV |
10% |
4% |
|
3.8% |
17% |
|
2. Adulteration of CAR DIESEL with HEATING DIESEL |
|||||
|
R2 |
0.978 |
0.999 |
0.862 |
0.967 |
0.98 |
|
RMSECV |
10% |
1% |
18% |
13% |
9% |
|
3. Adulteration of CAR DIESEL with MARINE DIESEL |
|||||
|
R2 |
0.985 |
1.00 |
0.496 |
0.931 |
0.995 |
|
RMSECV |
10% |
2% |
30% |
21% |
4% |
|
6. Adulteration of CAR DIESEL with SN150 LUBRICANT |
|||||
|
R2 |
|
0.994 |
0.994 |
|
|
|
RMSECV |
|
6% |
9% |
|
|
WP3
The design and development of the initial version of the portable fuel adulteration detection prototype spectrometer instrument (prototype for short) is now complete.
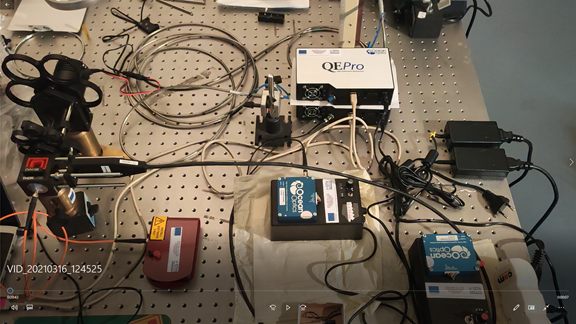
The above figure shows the experimental components on an optical table, during the development of the portable optical spectroscopy system for adulteration detection in liquid fuels.
The system under development can simultaneously perform Raman and VIS-UV absorption spectroscopic measurements, in a cell containing the liquid fuel and is composed of two (2) systems, which consist of: 1) CW laser sources, connected to the respective high sensitivity spectrographs, for Raman measurements at 784 nm and 1064 nm as well as 2) a white light source with filters and spectrograph, in the VIS-UV region, for absorption measurements. As for the mechanical system that carries the cell, it has been constructed so that it has observation windows. Observation windows have sockets, where optical systems are adapted, with optical fibers, both for irradiation of the sample and for the spectroscopic measurements in the spectrographs. In the various optical systems, the connection between the laser source and the cell is made with optical fiber and the use of a special probe, which a) Focuses the laser beam on the liquid sample, b) Collects the generated Raman emission, c) Uses a second optical fiber, which has a laser beam wavelength cut-off filter to guide the Raman emission from the sample to the spectrograph. Meanwhile, special software is used to set the measurement parameters of the spectrograph and to store the spectra.
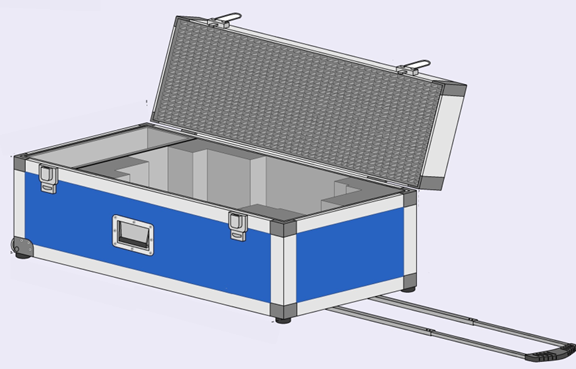
Respectively, the VIS-UV spectrograph is connected to an optical fiber and optical focusing system, in one of the observation windows of the mechanical system of the liquid fuel cell. This optical system connects the radiation sources, the sample and the spectrographs with optical fibers to: a) Minimize the development time of the system, b) Minimize the measurement time and c) Avoids the particularly complex problems of optical alignments, in the case of field measurements. In addition, this choice for the portable system ensures repeatability and accuracy of measurements. Also, the overall, aforementioned device is placed in a special suitcase, as shown below, which it is compact, light-weight, with the individual subsystems located in specially designed pockets lined with anti-vibration material, for transport and field measurements.
The first edition of the portable system for adulteration detection was calibrated by TUC team with WP1 samples at IESL-FORTH labs to also test the portability of the system. For these tests, the system was powered by the electrical grid. A sample Raman spectrum recorded with the portable system is shown below.
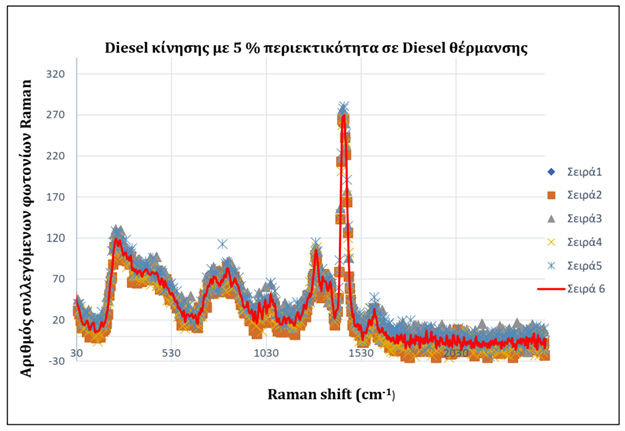
The spectrum is in good agreement with WP2 Raman measurements. Calibration is nearly completed and we expect to be able to use the portable instrument in measurements of samples from the fuel production and distribution chain.
WP4
In WP4 we measure “unknown” samples from the fuel production and distribution chain. Its implementation will start shortly.

Funding